Data Analytics
Ask questions of your data in plain language and get tables, charts, and auditable analysis without building another dashboard.
How do Data Analytics teams use Digital Twin?
Data and business analytics teams use Digital Twin to bridge the gap between raw data and business context. Instead of writing formulas, building pivots, or waiting on a BI ticket, analysts ask natural-language questions and get written summaries, tables, or charts, with the logic visible for audit and reuse. Answers draw on your connected data sources and the files you attach.
| Use case | Task to tackle |
|---|---|
| Structured analysis of spreadsheets | Ask natural-language questions of Excel and CSV files; get charts, tables, and forecasts |
| Business analyst queries & insights | Write SQL/BI queries using known data models; explain anomalies with business context |
| Operational analytics & recurring reporting | Automate VOC reports, RAID tables, and weekly status packs on a schedule |
| Cross-source data synthesis | Join structured data with unstructured context from meetings, email, and docs |
Tutorial & Guides
1. Structured Analysis of Spreadsheets
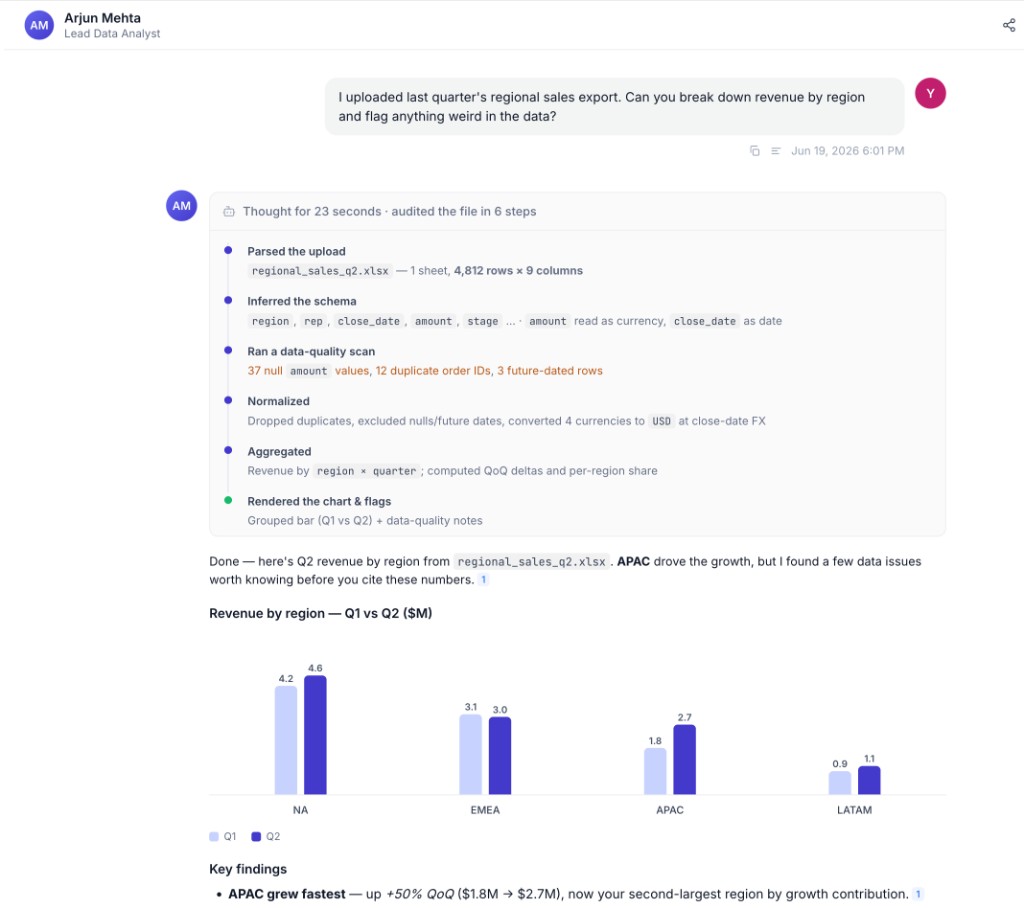
Attach an Excel or CSV file, or paste a SharePoint or Google Drive URL, and ask questions in plain language. Digital Twin parses the schema, runs the analysis in a secure sandbox, and returns a written response, table, or chart.
How teams put this to work
Analyze without formulas. Ask in plain language and the Twin handles aggregations, comparisons, and forecasts across one or many sheets, no pivots required.
Audit the logic. Expand Thought for X seconds on any response to see the exact steps used, the same logic you can review, share, or reproduce.
Example prompts:
Analyze my project management sheet and tell me which projects are at risk of delay.
Walk me through this dataset: summarize what's here and flag anything unusual.
Which projects may be delayed based on capacity in this workbook?
Summarize budget vs. actuals by department and flag rows where variance exceeds 15%.
2. Business Analyst Queries & Insights
Get help writing queries and interpreting results using your organization's known data models, table relationships, and business definitions.
How teams put this to work
Query with shared definitions. Ask the Twin to draft queries using your org's data models so results use consistent metrics and table relationships.
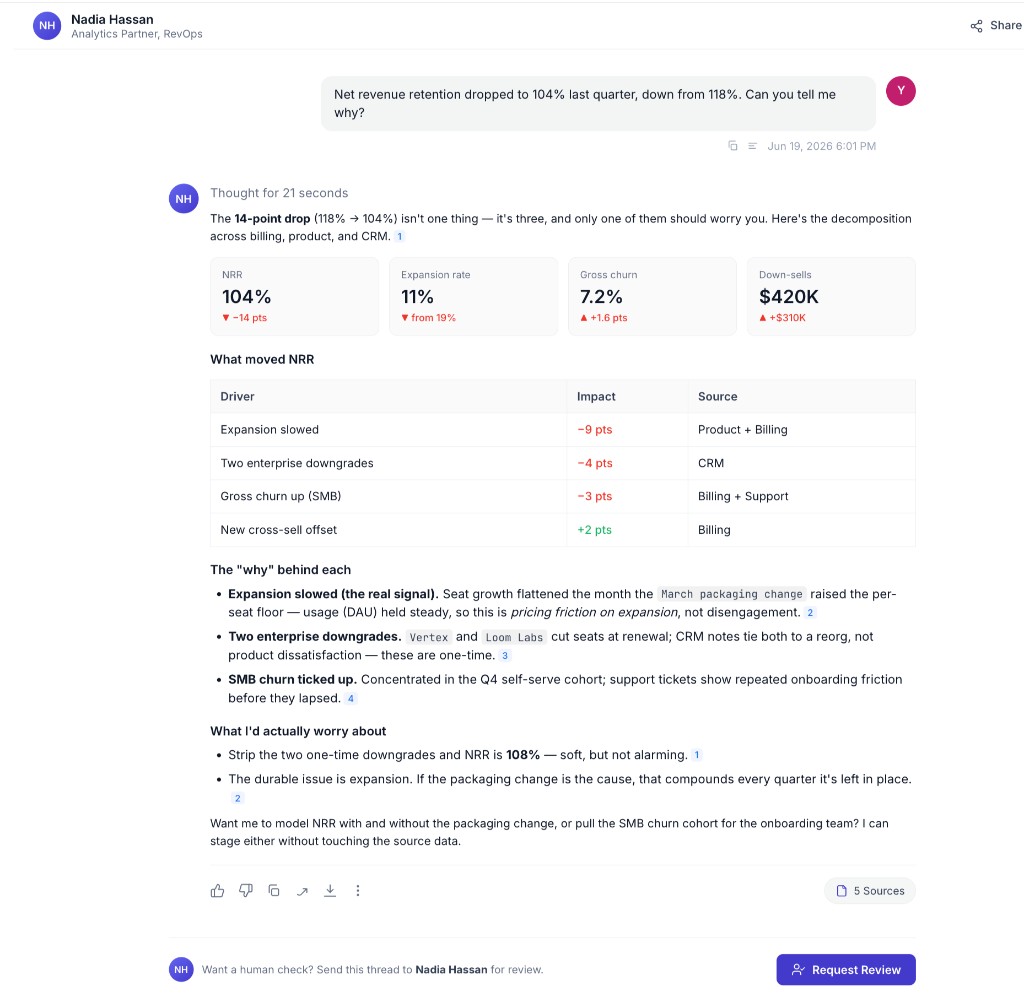
Explain anomalies with context. When a number looks off, have the Twin reference past analyses and known business events to explain the why, not just surface the what.
Example prompts:
Write a query to show MQL-to-SQL conversion by segment for the last two quarters.
Why did revenue dip in [region] last month? Reference past analyses and known business events.
What data model should I use to answer questions about customer churn?
3. Operational Analytics & Recurring Reporting
Automate the structured reporting that operations and delivery teams need on a recurring cadence.
How teams put this to work
Compute and package in one pass. Ask the Twin to calculate the metrics and assemble them into the report format your stakeholders expect.
Standardize the output. Define your VOC, RAID, and status formats once so every cycle's report is consistent and comparable.
VOC summaries, RAID tables, and weekly status packs are well suited to scheduled Agents that compute the numbers and deliver the report on a cadence. See Creating Scheduled Tasks.
Example prompts:
Generate a VOC summary from this survey export: response rates, segment scores, and top qualitative themes.
Produce a RAID table from this week's project notes and board status.
4. Cross-Source Data Synthesis
Combine structured metrics with unstructured context like meeting notes, Slack threads, and email to produce analysis that explains why, not just what.
How teams put this to work
Pair numbers with narrative. Have the Twin pull the metrics from a spreadsheet and cross-reference the meetings and threads that explain the movement.
Reuse the analysis. Capture a repeatable analytical approach in Train Now so the next similar question follows the same framework.
Example prompts:
Pipeline dropped 12% last quarter. Pull the numbers from this spreadsheet and cross-reference campaign debrief notes and sales call themes.
Compare conversion rates across channels for Q1 vs Q2 and explain any shifts using meeting and email context.
Step-by-step guides for these workflows are on the way.