Structured Analysis
Digital Twin can analyze data in Excel and CSV files using plain language — no formulas, pivots, or dashboards required. Ask a question about your data and get back a written summary, a table, or a chart.
What you can do
- Compute aggregations, trends, and statistical metrics across your data
- Join and compare data across multiple sheets in a single workbook
- Identify gaps, anomalies, and risks
- Generate executive-ready summaries and exportable charts
Getting started
No setup or configuration is required. Structured Analysis is built into Digital Twin and works within your existing environment.
- Attach a file directly to your message (Attach files), or paste in the SharePoint/Google Drive URL of the file you want to analyze.
- Ask your question in natural language and send. Use Analyze when you want spreadsheet-focused analysis, or Think for deeper reasoning on multi-sheet workbooks.
- Digital Twin returns a written response, a table, or a chart — whichever best fits your question.
Ask your question
Type a plain-language prompt in the chat box. With Analyze selected, ask about risks, trends, or summaries in your sheet — for example, "analyze my project management sheet and tell me which projects are at risk of delay."

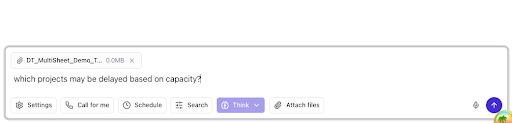
For multi-sheet workbooks, attach the file and select Think. Example: attach a capacity workbook and ask "which projects may be delayed based on capacity?"
Review the answer
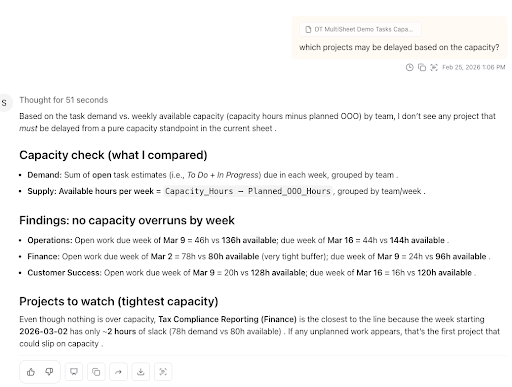
Digital Twin reads your file, compares demand and supply (or other metrics you asked for), and returns a structured write-up — capacity checks by team, findings, and projects to watch.
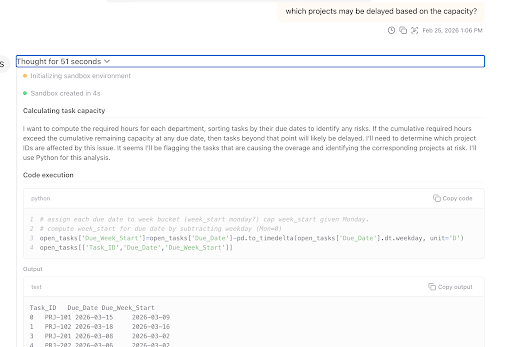
Audit the logic
To see exactly what Digital Twin used, expand Thought for X seconds (or Thinking) on the response. You will see the plan, sandbox initialization, and Code execution steps — the same logic you can review to reproduce or audit the result.
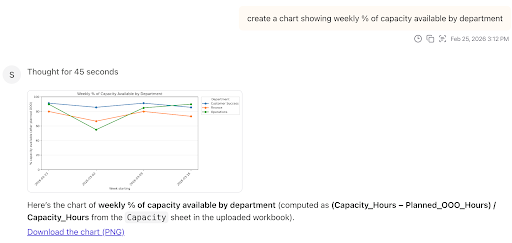
When a chart fits the question better, you get a visualization plus the formula or sheet logic used (for example, weekly capacity by department). Use Download the chart (PNG) to export it.
When to use it
| Team | Example questions |
|---|---|
| Sales |
|
| Customer Success |
|
| Marketing |
|
| Business Analytics |
|
How it works
When you ask a question that involves structured data, Digital Twin:
- Parses your file and understands its schema (including multiple sheets in one workbook)
- Determines the analytical steps needed to answer your question
- Generates and executes the logic in a secure, sandboxed environment (visible in the thought pane)
- Returns a written response, table, or chart you can share or download
Frequently asked questions
Excel (.xlsx) and CSV files. You can reference a file stored in SharePoint or Google Drive, or upload it directly into your chat session. Digital Twin can also retrieve a relevant file on its own if you describe what you're looking for.
No. Digital Twin only reads your file and produces separate derived outputs — tables, summaries, and charts. Your source file is never changed.
Yes. Digital Twin can automatically join related sheets within a workbook and compute cross-sheet metrics without any manual data modeling on your end.
Most operational workbooks are supported. The typical upper limit is 50 MB.
Aggregations and group-bys, percent changes and deltas, forecasting and projections, gap analysis, statistical summaries, and chart generation.
Yes. Digital Twin can reference multiple files and merge them as needed to answer your question.
Yes. The exact logic used to generate an analysis is visible in the Thought Pane. You can review, share, or reuse it at any time.
No additional vendors or external processing pipelines are introduced. Data is processed within the same secure model interaction flow used by Digital Twin, under the same enterprise-grade security and governance controls that apply to DT today.
No. Structured Analysis uses the same secure API architecture as the rest of Digital Twin. It does not create persistent code artifacts, open external execution channels, store executable scripts, or enable arbitrary system access.
No. There is no Python environment, notebook server, or scripting tool to install or maintain. From a user perspective, this is simply natural language analysis over structured data.
No new infrastructure or processing environments are introduced. The feature operates under the same compliance, logging, and data handling policies that apply to Digital Twin today.
For a walkthrough, see the Loom demo.